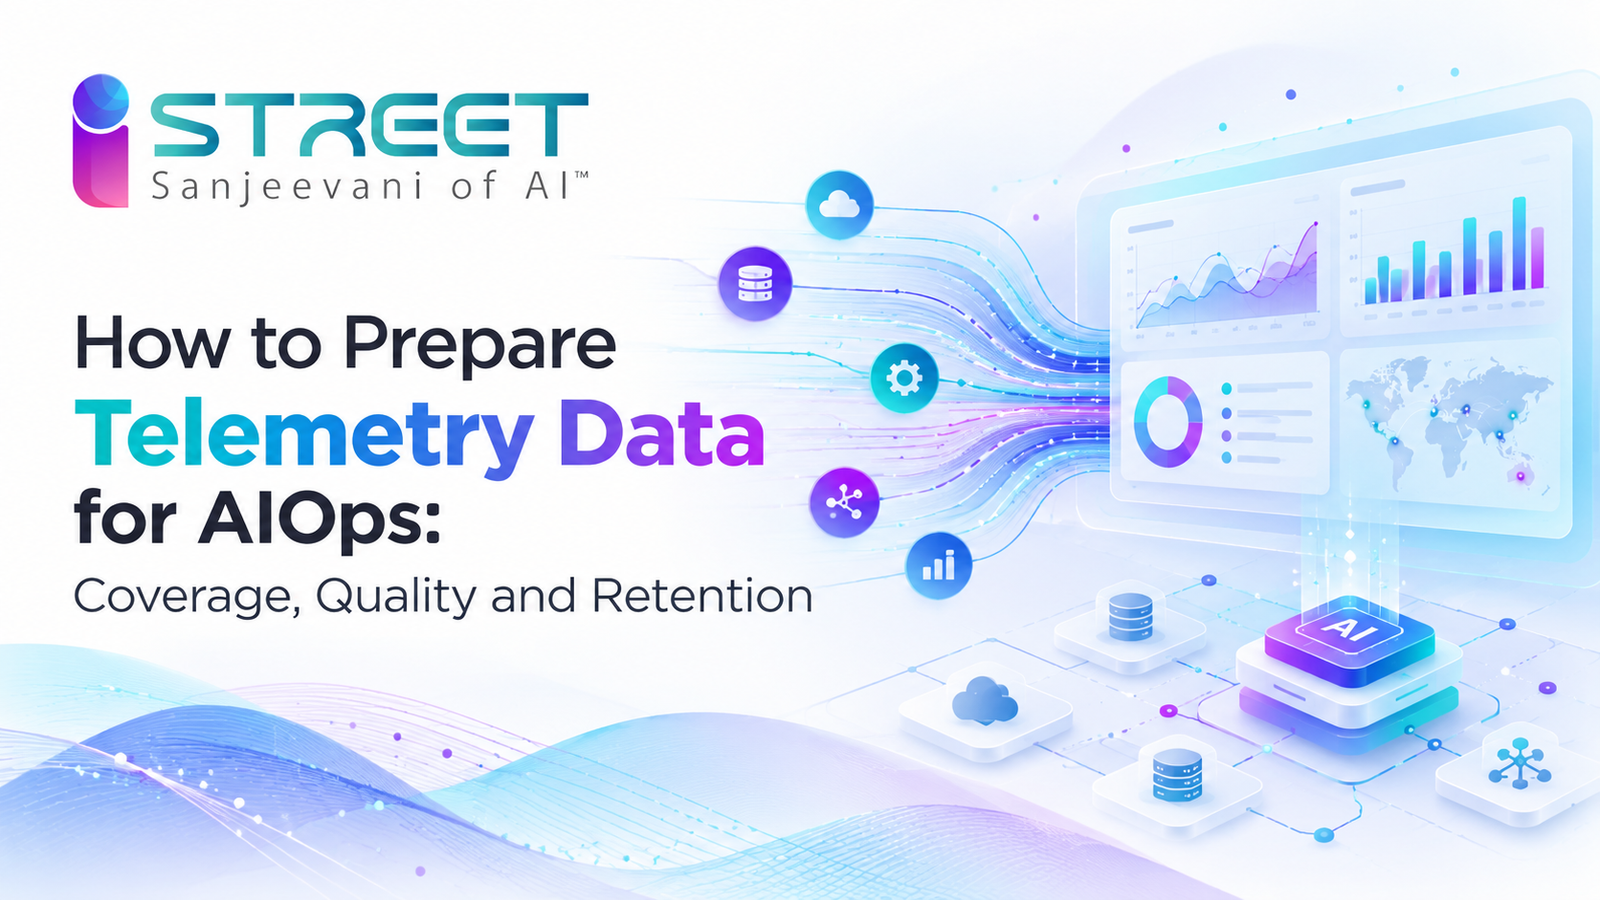
Preparing telemetry data for AIOps requires three essential capabilities: complete visibility across critical systems, consistent and reliable operational data, and sufficient historical information for AI-driven analysis.
Without these foundations, even advanced AIOps platforms can struggle to correlate events, identify likely root causes, and detect emerging service disruptions. Enterprises already collect significant volumes of logs, metrics, traces, and operational events. However, collecting telemetry is not the same as preparing it for artificial intelligence. The difference lies in whether the data can explain what happened, where it happened, how different systems are connected, and which business services are affected.
What Is Telemetry Data in AIOps?
Telemetry data in AIOps refers to machine-generated operational information collected from applications, infrastructure, networks, and digital services that AI and machine learning systems analyse to detect anomalies, correlate events, and support incident resolution.
AIOps typically relies on multiple telemetry sources:
| Telemetry Type | What It Captures | How AIOps Uses It |
| Metrics | CPU, memory, latency, throughput, error rates | Anomaly detection and performance baselining |
| Logs | Application errors, system activity, diagnostic records | Incident investigation and root cause analysis |
| Traces | End-to-end request execution across services | Service dependency and transaction analysis |
| Events | Operational state changes, warnings, alerts | Event correlation and noise reduction |
| Topology data | Relationships between systems and services | Impact analysis and likely fault-area identification |
| ITSM data | Incidents, changes, historical resolutions | Incident context and remediation recommendations |
These data sources serve different purposes, but their combined value comes from correlation. This is why telemetry preparation should focus on three foundational pillars: coverage, quality, and retention.
Telemetry Coverage: Are You Collecting the Right Operational Signals?
Telemetry coverage measures whether the critical components, dependencies, and business transactions in an IT environment are represented by usable operational data.
AIOps requires sufficient coverage to understand not only individual components but also the relationships between them.
How Do You Identify Telemetry Coverage Gaps?
Begin by mapping critical business services to the underlying technology stack.
For each service, identify:
- Applications, APIs, microservices, and middleware
- Servers, virtual machines, containers, and cloud resources
- Databases, storage systems, and network dependencies
- Third-party integrations and external services
- Relevant business transactions and digital user journeys
Determine whether the necessary metrics, logs, traces, and events are available for each component. Coverage gaps appear when critical dependencies lack instrumentation, transaction paths cannot be reconstructed, or essential monitoring signals remain isolated across tools.
Telemetry Data Quality: Can AIOps Trust the Information It Receives?
Telemetry data quality describes the accuracy, completeness, consistency, freshness, and contextual relevance of operational information used by AIOps systems.
AI models cannot reliably reconstruct an incident when the supporting telemetry is incomplete, incorrectly labelled, or temporally inconsistent. Without standardisation, related events may appear unrelated, making correlation and diagnosis more difficult.
What Are the Essential Telemetry Data Quality Requirements?
| Quality Dimension | Requirement | Operational Impact |
| Completeness | Required data fields and telemetry signals are present | Reduces blind spots in analysis |
| Accuracy | Measurements and event attributes correctly represent system behaviour | Supports reliable anomaly detection |
| Consistency | Naming conventions, units, and schemas are standardised | Improves cross-platform correlation |
| Freshness | Telemetry is received within defined latency thresholds | Supports timely incident detection |
| Context | Records contain relevant service, resource, and transaction identifiers | Enables service-aware investigation |
| Integrity | Missing, malformed, and duplicate records are detected | Reduces misleading operational signals |
How Can Enterprises Improve Telemetry Data Quality?
Standardise telemetry attributes. Establish common naming conventions for applications, services, hosts, environments, and operational events.
The OpenTelemetry Semantic Conventions define shared names for attributes associated with traces, metrics, logs, and resources. These conventions can help reduce inconsistencies between instrumentation sources.
Synchronise timestamps. Maintain consistent time synchronisation across relevant systems and preserve accurate event timestamps. This helps distinguish the initial failure from downstream symptoms.
Enrich records with operational context. Associate telemetry with application ownership, service identifiers, topology relationships, environment details, and deployment changes.
Detect missing and delayed telemetry. Monitor ingestion failures, dropped records, stale signals, and unexpected changes in telemetry volume.
Control sensitive information. Apply appropriate filtering, redaction, access restrictions, and governance controls before operational data is stored or shared with downstream systems.
Why Does Context Matter for AI-Assisted Root Cause Analysis?
Consider an application generating repeated database connection errors. An isolated log identifies the error, but it does not establish why the connection failed. When AIOps can correlate that log with database connection metrics, application traces, service dependencies, and a recent configuration change, investigators gain a stronger basis for identifying the likely cause.
High-quality telemetry is therefore not simply clean data. It is operational data with enough context to establish meaningful relationships across systems and incidents.
Which KPIs Measure Telemetry Quality?
Enterprises should monitor required-attribute completeness, ingestion latency, duplicate-record rates, dropped-record rates, and the proportion of critical telemetry that can be associated with an identified service.
These measurements help determine whether the data foundation is improving as AIOps adoption expands.
Telemetry Retention: How Much Historical Data Does AIOps Need?
AIOps telemetry retention is the process of preserving operational data for a defined period so AI models and IT teams can analyse historical behaviour, investigate incidents, and identify performance trends.
There is no single retention duration suitable for every AIOps implementation. The appropriate period depends on workload patterns, analytical requirements, incident investigation needs, data sensitivity, storage costs, and applicable governance obligations.
Why Does Historical Telemetry Matter for AIOps?
Historical information supports several important operational capabilities.
Anomaly detection: AI models compare current behaviour against previously observed patterns. Systems with daily, weekly, or seasonal workload variations require sufficient representative history to distinguish expected activity from unusual conditions.
Root cause analysis: Historical metrics, traces, logs, events, and change records help operations teams reconstruct incident sequences and investigate recurring failures.
Predictive capacity planning: Resource utilisation and performance trends help estimate future demand and identify potential capacity constraints.
Incident correlation: Historical incident patterns and resolution records can provide context for identifying repeated failure conditions and recommending appropriate responses.
How Should Enterprises Define Telemetry Retention Policies?
Retention should be defined by data category and intended use rather than applying one uniform policy across the environment.
| Telemetry Category | Primary Retention Consideration |
| High-resolution metrics | Immediate investigation needs and aggregation strategy |
| Application logs | Diagnostic value, incident reconstruction, sensitivity |
| Distributed traces | Critical transaction visibility and sampling requirements |
| Alerts and events | Historical correlation and incident trend analysis |
| Aggregated metrics | Long-term baselining and capacity forecasting |
| Incident and change history | Operational learning, investigation, governance |
A tiered storage model can separate frequently accessed recent telemetry from lower-cost historical storage. The actual durations should be selected through a documented assessment rather than treating illustrative retention periods as universal standards.
How Do You Build an AIOps-Ready Telemetry Data Pipeline?
An AIOps-ready telemetry pipeline continuously collects, standardises, enriches, validates, and routes operational data so it can be used for real-time analysis and historical investigation.
A practical pipeline consists of seven stages:
| Stage | Activity | Outcome |
| 1. Collect | Ingest metrics, logs, traces, and events | Operational visibility |
| 2. Normalise | Standardise schemas, timestamps, and naming | Consistent information |
| 3. Enrich | Add service, ownership, topology, and change context | Correlatable telemetry |
| 4. Validate | Detect missing fields, invalid records, and ingestion problems | Reliable data |
| 5. Protect and optimise | Apply sensitive-data controls, filtering, and appropriate sampling | Governed collection |
| 6. Retain | Route data to suitable storage tiers | Accessible historical evidence |
| 7. Analyse | Apply AIOps models for detection, correlation, and investigation | Operational intelligence |
The OpenTelemetry Collector can support parts of this pipeline through its receiver, processor, and exporter architecture. The collection pipeline itself should also be observable. Otherwise, a failure in telemetry ingestion may be mistaken for the absence of an application problem.
How Can Enterprises Evaluate Their AIOps Telemetry Readiness?
A readiness assessment should establish whether existing operational data is suitable for the specific AIOps use cases an enterprise intends to deploy.
The following checklist provides a practical starting point.
Enterprise AIOps Telemetry Readiness Checklist
| Assessment Area | Question | Readiness Evidence |
| Service coverage | Are critical applications and dependencies instrumented? | Coverage inventory |
| Cross-domain visibility | Can telemetry be connected across applications, infrastructure, and networks? | Service dependency mapping |
| Data consistency | Are naming conventions and schemas standardised? | Schema validation reports |
| Correlation readiness | Can related events, traces, and incidents be linked? | Shared identifiers and metadata |
| Data freshness | Are ingestion delays and missing signals monitored? | Pipeline health metrics |
| Historical sufficiency | Is enough representative history available for intended models? | Retention and baseline assessment |
| Governance | Are access, sensitive-data handling, and retention policies enforced? | Approved control documentation |
| Operational integration | Can AIOps findings support ITSM and response workflows? | Integration and workflow tests |
The outcome should be a prioritised remediation plan identifying coverage gaps, data-quality weaknesses, and retention limitations that affect the highest-value AIOps use cases.
What Should an Enterprise Prioritise First?
Start with one critical business service rather than attempting an enterprise-wide telemetry transformation immediately. Map its dependencies, validate the required signals, establish data-quality thresholds, and verify that historical data is sufficient for the intended analysis. Once this foundation is reliable, expand the approach across additional services and operational domains. This creates a repeatable implementation model while making improvements measurable.
How Does Telemetry Readiness Improve AIOps Outcomes?
Preparing telemetry creates the foundation for more reliable AI-driven IT operations. The operational benefits become clearer when data-readiness improvements are mapped to specific AIOps capabilities.
| Telemetry Improvement | AIOps Capability Supported | Expected Operational Benefit |
| Better service coverage | Cross-domain event correlation | More complete incident context |
| Consistent and enriched records | AI-assisted root cause analysis | Faster identification of likely causes |
| Reliable historical metrics | Predictive anomaly detection | Earlier recognition of abnormal behaviour |
| Historical capacity trends | Capacity forecasting | More informed infrastructure planning |
| Connected ITSM and change information | Incident analysis and remediation | Better-informed response decisions |
| Stronger pipeline governance | Controlled AI operations | Improved traceability and operational oversight |
These benefits are potential outcomes, not automatic results. Their magnitude depends on implementation quality, model performance, operational integration, and measurable baselines. An enterprise should evaluate success through metrics such as mean time to detect (MTTD), mean time to resolve (MTTR), alert reduction, investigation time, and the proportion of incidents supported by correlated telemetry.
iStreet Network Supports Telemetry-Driven AIOps
Preparing telemetry is the foundation. Converting that data into operational intelligence requires observability, analytics, service context, and incident-response capabilities working together. iStreet Network’s Sanjeevani of AI™ framework brings AI-native capabilities into enterprise operations with an emphasis on resilience, security, sovereignty, and governance.
Within its resilient operations portfolio, iStreet AI Observability brings together logs, metrics, traces, application performance, infrastructure health, and digital experience signals to establish correlated operational visibility. Building on that foundation, iStreet AIOps & GenAIOps applies machine learning, event correlation, predictive analytics, topology-aware root cause investigation, and GenAI-assisted incident analysis.
Together, these capabilities are designed to help enterprises:
- Connect operational telemetry across applications, infrastructure, networks, and ITSM systems.
- Identify anomalies using behavioural analysis and dynamic baselines.
- Correlate related alerts and reduce repetitive investigation.
- Analyse service dependencies and incident timelines to identify likely causes.
- Support automated or human-approved remediation workflows.
- Bring operational context into a unified, service-aware view.
The objective is to move beyond isolated monitoring signals and establish an operational model in which telemetry supports decisions, investigations, and governed actions.
Better AIOps Starts with Better Telemetry
AIOps cannot compensate for every blind spot in enterprise monitoring. If critical systems lack coverage, related records cannot be correlated, or historical evidence is unavailable, AI-assisted analysis will be constrained by those limitations.
Coverage determines what AIOps can see. Quality determines what it can reliably interpret. Retention determines how much historical context it can use.
Enterprises that systematically improve these three dimensions establish a stronger foundation for intelligent event correlation, predictive anomaly detection, root cause analysis, and resilient IT operations. The strategic priority is not collecting the largest possible volume of telemetry. It is building an operational data foundation that enables reliable, timely, and contextual decisions.