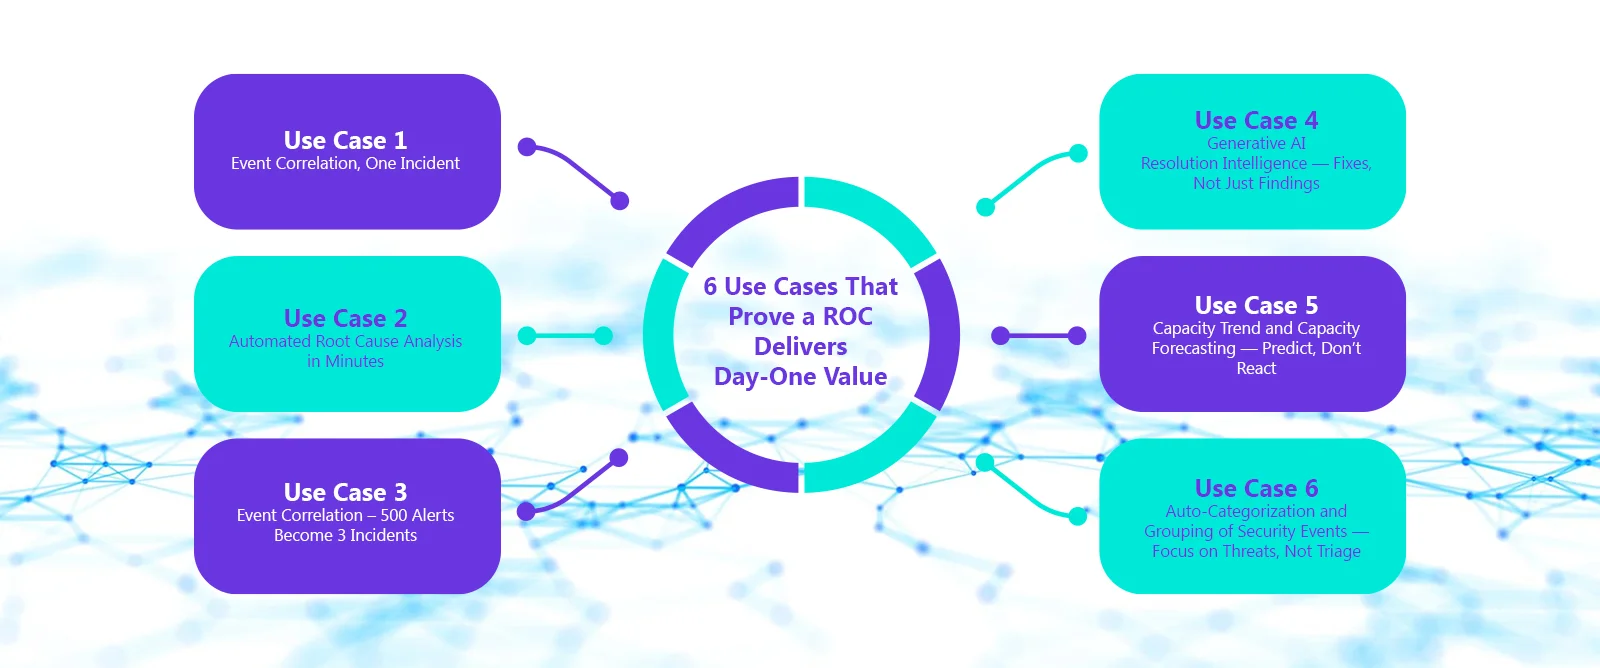
The biggest myth about a Resiliency Operation Centre is that it takes months to deliver results. It doesn’t. These six capabilities are operational from deployment, each one solving a specific, measurable problem that enterprises deal with every week.
Many enterprise technology investments involve extended implementation and optimisation cycles before measurable value becomes visible. ROC adoption addresses a different challenge: the operational gaps it is designed to solve already exist in enterprises where NOC, SOC, application monitoring, and compliance functions operate with fragmented context. This creates an opportunity to demonstrate value progressively as these domains become more connected.
Each use case below maps to a specific operational pain, delivers a measurable outcome, and works from the day the ROC is connected to existing tools. No 12-month transformation runway. Observability platform ingests data from existing tools through open-telemetry standards, and these capabilities activate on the unified dataset immediately.
Use Case 1: Event Correlation, One Incident
The problem it solves:
A single root cause triggers alerts across infrastructure, security, and application monitoring simultaneously. NOC sees latency spikes. The SOC sees anomalous traffic. The APM shows elevated error rates. Three teams open three tickets, begin three parallel investigations, and spend the first 45–90 minutes of a bridge call discovering they’re looking at the same problem from different angles.
This pattern repeats multiple times per month in any enterprise running cloud-native architecture. Every occurrence waste engineering hour on coordination that adds zero diagnostic value.
What the ROC delivers:
The Observability platform ingests telemetry from all sources into a single data lake and applies AI-driven correlation across the full dataset. When three alerts share a common root cause, the AI identifies them as one event and presents a single, unified incident, one timeline, one blast radius, one business impact score, before anyone picks up the phone.
Application dependencies are auto discovered from live traffic in real time. No tribal knowledge required. When a component fails, the platform instantly maps every upstream and downstream dependency affected.
Measurable outcome: The coordination phase that currently consumes 45–90 minutes per cross-domain incident is eliminated. Engineering team shifts from building to resolving the problem. Enterprises deploying event correlation as their first ROC use case typically see MTTR reduction of 40–60% within the first 60 days, building toward the 60–75% reduction enterprises reach once the full ROC is running
Use Case 2: Automated Root Cause Analysis in Minutes
The problem it solves:
Root cause analysis in a siloed environment is a manual, cross-tool exercise. An engineer pulls logs from one platform, metrics from another, traces from a third, and attempts to correlate timestamps and anomaly patterns across all of them, under pressure, often without full context of what other teams are simultaneously investigating.
For most enterprises, the RCA phase alone consumes 2–4 hours per major incident. Most of that time isn’t analysis, it’s data gathering. The engineer knows how to diagnose the problem. They just can’t get all the data into one place fast enough.
What the ROC delivers:
With all telemetry unified in a single data lake, the AI correlation engine performs root cause analysis across millions of events simultaneously. It identifies the actual root cause, not the loudest symptom, not the most recent alert, but the originating failure and surfaces it with supporting evidence.
The AI distinguishes between cause and effect. When 500 alerts fire, 497 of them are downstream symptoms. The platform identifies the 3 that matter and traces the causal chain back to the origin point. The engineer receives a diagnosis.
As the knowledge base grows, the AI also matches current RCA patterns against historical incidents, flagging when a root cause has recurred and surfacing the resolution that worked previously. Repeat failures are identified and escalated for permanent remediation rather than being resolved with the same temporary fix every time.
Measurable outcome: RCA time drops from hours to minutes. The data-gathering phase is eliminated entirely. Engineers spend 100% of their incident time on diagnosis and resolution instead of the current 30–40%. For enterprises experiencing 8–12 major incidents per quarter, this represents hundreds of engineering hours recovered annually.
Use Case 3: Event Correlation – Alerts to Incidents
The problem it solves:
On-call engineers wake up to hundreds of alerts. Most are noise, symptoms, duplicates, cascading effects, low-priority threshold breaches that flood the queue and bury the signals that actually require attention. Manual triage absorbs the first 30–60 minutes of every major event, and alert fatigue is burning out the best practitioners in the rotation.
The numbers are stark, almost 90% of SOCs report being overwhelmed by alert backlogs and false positives. Security teams spend more than 25% of their time handling false positives. The average enterprise receives 1000+ security alerts per day, and that’s just the security layer. Infrastructure and application monitoring add hundreds more.
What the ROC delivers:
AI-driven event compression correlates related alerts, across infrastructure, security, and application domains, and consolidates them into a small number of actionable incidents. Each consolidated incident includes full context: the correlated events that comprise it, the identified root cause, the affected systems and business services, the business impact score, and recommended response actions.
Alert volumes can be consolidated into a smaller number of correlated, context-rich incidents. This gives on-call engineers a more focused view of issues that require investigation, rather than requiring them to work through large volumes of fragmented alerts.
The AI ranks the consolidated incidents by business impact, not just technical severity. An incident affecting the payment processing pipeline ranks above an incident affecting an internal reporting dashboard, even if the latter triggered more raw alerts.
Measurable outcome: Alert volume reduction of 85–95%. On-call engineer triage time drops from 30–60 minutes to under 5 minutes per event. Alert fatigue decreases measurably. On-call satisfaction improves.
Use Case 4: AI Resolution Intelligence — From Root Cause to Resolution Guidance
The problem it solves:
Many monitoring, observability, and security tools are strongest at detection, correlation, and diagnosis, while environment-specific resolution can still depend heavily on human expertise. The “how to resolve it” stage is often handed to an experienced engineer who understands the architecture, recognises the pattern, and can determine an appropriate resolution path. When that expertise is not readily available, investigation and resolution can take longer. As a result, recurring incidents may still require teams to reconstruct context and determine the appropriate response, even when similar patterns have occurred before.
What the ROC delivers:
When a similar pattern reappears, the AI surfaces the resolution recommendation: root cause, recommended fix, estimated resolution time, affected systems, confidence level. The engineer on shift, regardless of tenure or experience level, validates and executes instead of diagnosing from scratch.
The AI doesn’t just retrieve exact matches. It reasons across similar-but-not-identical incidents. A current event that shares 70% similarity with a previous pattern generates a contextualized recommendation that accounts for the differences. This is the capability that most closely replicates what the senior engineer does on a bridge call, except it’s available 24/7, never forgets a pattern, and gets smarter with every incident.
Measurable outcome: Resolution time for recurring and similar patterns drops by 50–70%. Expert dependency, measured by the MTTR differential between incidents handled with and without senior engineers, decreases significantly within the first two quarters. New team members reach operational effectiveness faster because AI provides the environmental context that previously required months of experience to accumulate.
Use Case 5: Capacity Trend and Capacity Forecasting
The problem it solves:
Many enterprises identify capacity constraints only after service performance begins to degrade. A database approaches its storage limit. A container cluster reaches memory capacity during a traffic spike. A message queue reaches its throughput limit during a batch-processing window. Each event can trigger urgent operational intervention, including rapid scaling or maintenance, while teams work to restore capacity and service performance.
These aren’t unpredictable events. They’re the predictable consequence of resource consumption trends that nobody was watching, because the monitoring tools flag current-state thresholds, not future-state trajectories.
What the ROC delivers:
“At current growth rate, this database cluster will reach connection pool limits in 14 days.” “Storage volume utilization is trending toward threshold, projected breach in 9 days based on ingestion trends.” “Container cluster memory headroom is narrowing, based on the last 3 deployment cycles, the next release will likely exceed available capacity.”
These aren’t alerts. They’re forecasts with timelines. The operations team schedules a capacity increase during a maintenance window instead of responding to an outage. The difference between planned maintenance and emergency firefighting is measured in cost, and customer impact.
Measurable outcome: Capacity-related incidents, typically 15–25% of total incident volume, decrease by 60–80% as the team transitions from reactive response to proactive planning. After-hours emergency maintenance decreases.
Use Case 6: Auto-Categorization and Grouping of Security Events
The problem it solves:
Security teams can spend significant time on triage, manually categorising, classifying, and prioritising security events to distinguish genuine threats from false positives. According to the SANS 2025 Detection & Response Survey, 73% of organisations identified false positives as a leading detection challenge. High alert volumes can also leave security teams unable to investigate every alert, increasing the risk that important signals are delayed or overlooked.
The triage burden isn’t just an efficiency problem. It’s a security risk. When analysts are overwhelmed by volume, real threats hide in the noise. Alert fatigue leads to desensitization.
What the ROC delivers:
Security events are automatically categorized by type, grouped by relationships, and enriched with operational context the moment they’re ingested. The AI doesn’t just classify the security event; it connects it with what’s happening in the infrastructure and application layers.
An anomalous API traffic pattern isn’t just labelled “suspicious network activity.” It’s correlated with the application performance data showing that the same API endpoint is experiencing elevated latency, the infrastructure data showing unusual CPU consumption on the backend service, and the compliance data showing that the affected service processes payment data requirements. The security analyst receives a fully contextualized threat assessment, not a raw alert requiring 30 minutes of manual enrichment.
False positive volume drops because the AI applies cross-domain context that single-domain security tools can’t access. A login from an unusual location that a SIEM flags as suspicious is automatically contextualized: the user is an employee currently travelling (HR data), accessing a system they regularly use (application data), from a corporate device that passed its last compliance check (endpoint data). The alert is automatically downgraded. The analyst never wastes time on it.
Incidents that are confirmed as genuine threats are created with full context already attached, affected systems, blast radius, business services impacted, recommended mitigation actions. The analyst moves directly from detection to response without the manual enrichment step that currently consumes most of the triage cycle.
Measurable outcome: False positive volume decreases by 60–80%. Security analyst time spent on manual triage decreases proportionally, redirecting threat hunting and proactive security architecture. The percentage of alerts that go uninvestigated, currently 30% or higher in most SOCs, drops toward zero because the AI pre-triages the full volume. Mean time to respond for confirmed threats decreases because enrichment and contextualization happen automatically instead of manually.
The Common Thread: Value From Day One
Six capabilities that can begin delivering value as the ROC integrates with existing enterprise tools, enabling a phased path to operational impact without requiring a large-scale transformation upfront.
But the common thread isn’t just speed to value. It’s the compounding effect.
Event correlation makes RCA faster. Faster RCA feeds better data into the resolution knowledge base. A richer knowledge base makes resolution intelligence more accurate. More accurate resolution intelligence means faster resolution. Faster resolution generates more data that makes the AI smarter.
Each use case amplifies the others. The ROC doesn’t just deliver six independent capabilities, it delivers an operational flywheel where every incident resolved makes the next one faster, cheaper, and less dependent on individual expertise.
That flywheel starts spinning from day one. It never stops. And it never resets when someone leaves the team.
Choosing the First Use Case
For enterprises evaluating a ROC, the natural question is: where do we start?
The answer depends on where the biggest pain is. If cross-domain bridge calls are the primary frustration, start with event correlation. If MTTR is the metric leadership tracks most closely, start with automated RCA. If alert fatigue is driving attrition in the security or SRE team, start with event compression or security event auto-categorization. If capacity-related incidents dominate the incident log, start with forecasting.
The right first use case is the one that delivers the most visible, measurable result within 60 days, because that result becomes the evidence that funds the expansion to the remaining five.
Start with one. Prove value. Expand. The ROC is designed for exactly this trajectory.
About iStreet Network
iStreet Network’s Sovereign AI Enterprise Platform, built on the Sanjeevani of AI™ framework, enables enterprises to operationalize ROC use cases across existing technology environments: cross-domain event correlation, AI-driven root cause analysis, AI resolution intelligence, predictive capacity intelligence, intelligent security triage, and continuous governance and compliance visibility. Together, these capabilities help enterprises move from fragmented monitoring and manual coordination towards faster investigation, informed resolution, and stronger operational resilience.